Installation
The package can be installed from PyPI using pip install pymatgen-analysis-defects.
Once installed, the different modules can be imported via the pymatgen.analysis.defects namespace.
from pymatgen.analysis.defects import core, ccd, finderTo ensure that the namespace is installed properly run
and look at the __file__ variable to make sure that it is accessing the code from pymatgen-analysis-defect and not pymatgen.
Definition of a defect
Our code defines defects using a combination of bulk structure and sites.
Since the bulk primitive structure is, in principle, unique up to arbitrary translations, equivalence of defects can be now easily checked using StructureMatcher.
Below we show how you can create a basic substitutional defect from a pymatgen.core.Structure object by replacing one of the Ga atoms in GaN with Mg.
Note that we create a MgGa defect by creating a PeriodicSite Object mg_ga with the data of the first Ga site but
from pathlib import Path

from pymatgen.analysis.defects.core import Substitution
from pymatgen.core import PeriodicSite, Species, Structure

TEST_FILES = Path("../../../tests/test_files")
gan_struct = Structure.from_file(TEST_FILES / "GaN.vasp")
# make a substitution site
ga_site = gan_struct[0]
mg_site = PeriodicSite(
species=Species("Mg"), coords=ga_site.frac_coords, lattice=gan_struct.lattice
)
# instantiate the defect object
mg_ga = Substitution(structure=gan_struct, site=mg_site)
print(mg_ga)Mg subsitituted on the Ga site at at site #0
mg_ga.defect_structureStructure Summary
Lattice
abc : 3.2162901334217344 3.2162901334217344 5.239962
angles : 90.0 90.0 120.0000027445008
volume : 46.9428220153705
A : 1.608145 -2.785389 0.0
B : 1.608145 2.785389 0.0
C : 0.0 0.0 5.239962
pbc : True True True
PeriodicSite: Mg (1.608, -0.9285, 2.615) [0.6667, 0.3333, 0.4991]
PeriodicSite: Ga (Ga3+) (1.608, 0.9285, 5.235) [0.3333, 0.6667, 0.9991]
PeriodicSite: N (N3-) (1.608, -0.9285, 4.59) [0.6667, 0.3333, 0.8759]
PeriodicSite: N (N3-) (1.608, 0.9285, 1.97) [0.3333, 0.6667, 0.3759]Instantiating FormationEnergyDiagram
The object responsible for analyzing the formation energy is described by the following fields.
FormationEnergyDiagram(
    bulk_entry: 'ComputedStructureEntry',
    defect_entries: 'List[DefectEntry]',
    pd_entries: 'list[ComputedEntry]',
    vbm: 'float',
    band_gap: 'Optional[float]' = None,
    inc_inf_values: 'bool' = True,
)
Using a convenience constructor with_directories you can just feed in dictionary of {str: Path}
pointing to the directories where the supercell calculations are stored.
The keys, other than bulk will be the charge states of the calculations.
As long as the vasprun.xml and LOCPOT files are in the directories the FormationEnergyDiagram object can be constructed.
import warnings

from monty.serialization import loadfn
from pymatgen.analysis.defects.thermo import FormationEnergyDiagram

warnings.filterwarnings("ignore")

sc_dir = TEST_FILES / "Mg_Ga"
# ents = MPRester().get_entries_in_chemsys("Mg-Ga-N") # Query from MPRester
ents = loadfn(TEST_FILES / "Ga_Mg_N.json")  # Load from local
fed = FormationEnergyDiagram.with_directories(
    directory_map={
        "bulk": sc_dir / "bulk_sc",
        0: sc_dir / "q=0",
        -1: sc_dir / "q=-1",
        1: sc_dir / "q=1",
    },
    defect=mg_ga,
    pd_entries=ents,
    dielectric=10,
)
Getting the formation energy diagram
The chemical potential limits can be access using:
fed.chempot_limits[{Element Mg: np.float64(-1.4925347345833444),
Element Ga: np.float64(-1.7477270981249973),
Element N: np.float64(7.105427357601002e-15)},
{Element Mg: np.float64(-0.3500507727631543),
Element Ga: np.float64(-0.03400115539472637),
Element N: np.float64(-1.7137259427302567)},
{Element Mg: np.float64(-0.4350536612500093),
Element Ga: np.float64(0.0),
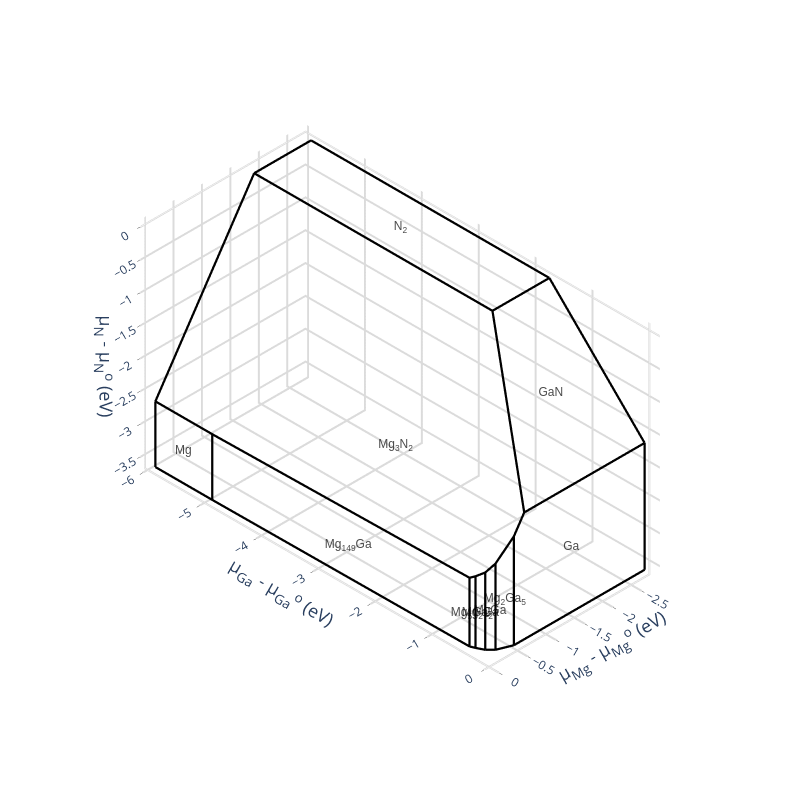
Element N: np.float64(-1.7477270981250044)}]If you have crystal_toolkit and the its jupyter lab extensions installed you can view the chemical potential diagram by importing crystal_toolkit and running a cell with the the chempot_diagram on the last line.
import crystal_toolkit
fed.chempot_diagram
Note that it is different from chemical potential plot hosted on the material project because the elemental phases are set to zero energy.
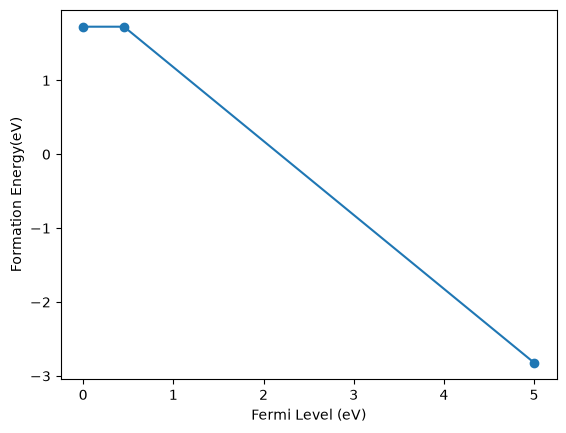
Now we can plot the formation energy diagram by calculating the Fermi level and formation energy at the different charge state transitions.
import numpy as np
from matplotlib import pyplot as plt

ts = np.array(fed.get_transitions(fed.chempot_limits[1], x_max=5))
plt.plot(ts[:, 0], ts[:, 1], "-o")
plt.xlabel("Fermi Level (eV)")
plt.ylabel("Formation Energy(eV)")